Guidelines: Statechart Diagram in the Business Object Model
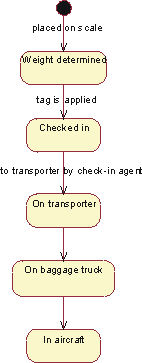
Generally, you can use a state diagram to illustrate which states a business worker or a business entity can have - the events that cause a transition from one state to another; and the actions that result from a state change. A statechart diagram often simplifies the validation of the class design.
For each state that an object of the class can enter, a diagram shows the messages it can receive, the actions to be carried out, and the state the object of the class will be in thereafter.

The business entity Baggage described with a statechart diagram.